my favs
Access and manage your favorites here
DISMISS
Home
Scores
Watch
Odds
Super 6
Stories
Search
Sign In
Account
SPORTS & TEAMS
PLAYERS
SHOWS
PERSONALITIES
SPORTS
SPORTS & TEAMS
PLAYERS
SHOWS
PERSONALITIES
SPORTS
NFL
NCAA FB
MLB
NBA
NCAA BK
NASCAR
Soccer
UFL
NCAAW BK
NHL
Golf
Premier Boxing Champions
WWE
UFC
WNBA
Tennis
Motor Sports
Professional Bowlers Association
Horse Racing
Westminster Kennel Club
FIBA
Olympics
World Baseball Classic
NRL
NCAA BK
NCAA BK
NCAA BK
A 10
A-Sun
AAC
ACC
Am. East
Big 12
Big East
Big Sky
Big South
Big Ten
Big West
C-USA
CAA
DI-IND
Horizon
Ivy
MAA
MAC
MEastern
MVC
MWC
NEC
OVC
Pac-12
Patriot
SEC
SLC
SWAC
Southern
Summit
Sun Belt
WAC
WCC
NCAA BASKETBALL
COLLEGE BASKETBALL
>
COLLEGE BASKETBALL
FEATURED
FEATURED
BRACKET
SCORES
SCHEDULE
TRANSFER PORTAL
POLLS
STATS
More
ODDS
NEWS
VIDEOS
CONFERENCES
PLAYER NEWS
SOCIAL
SPONSORED BY
EDITOR'S PICKS
MORE COLLEGE BASKETBALL NEWS
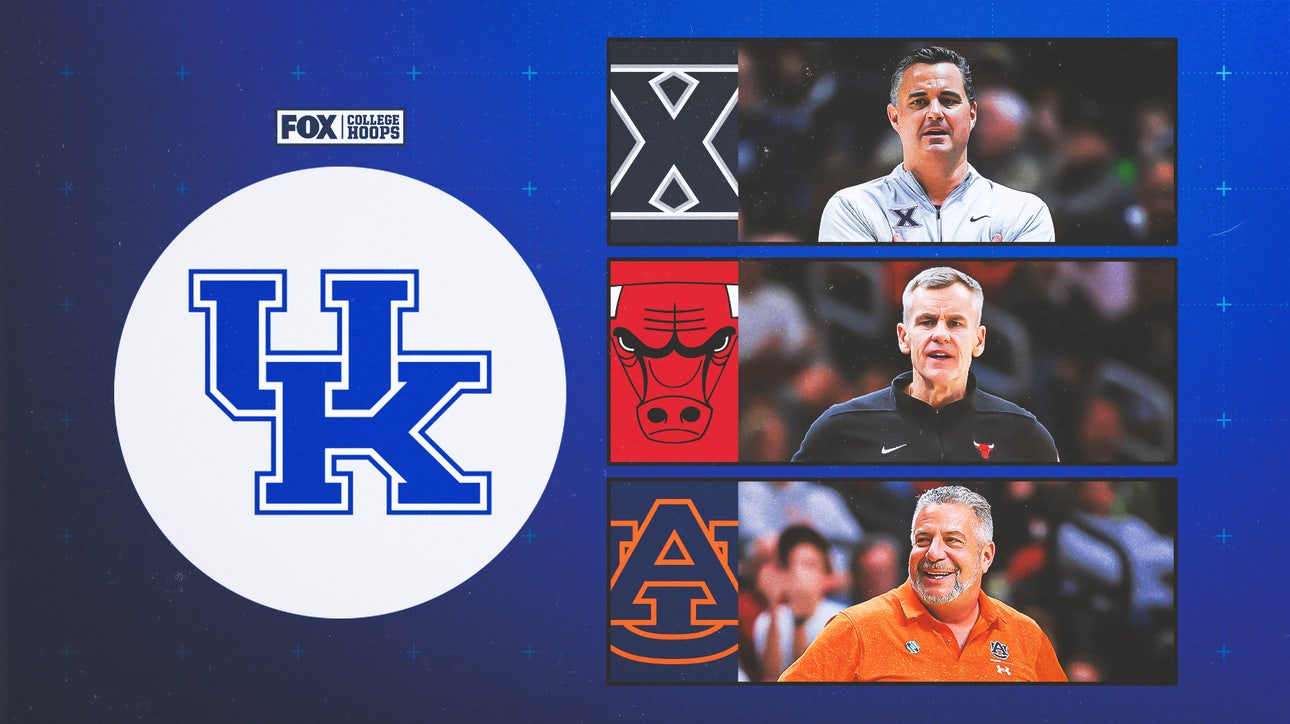
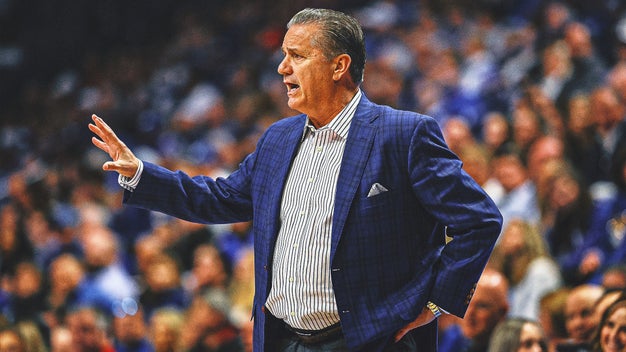
Kentucky basketball coaching candidates: Top names to replace John Calipari
5 DAYS AGO
•
FOX SPORTS
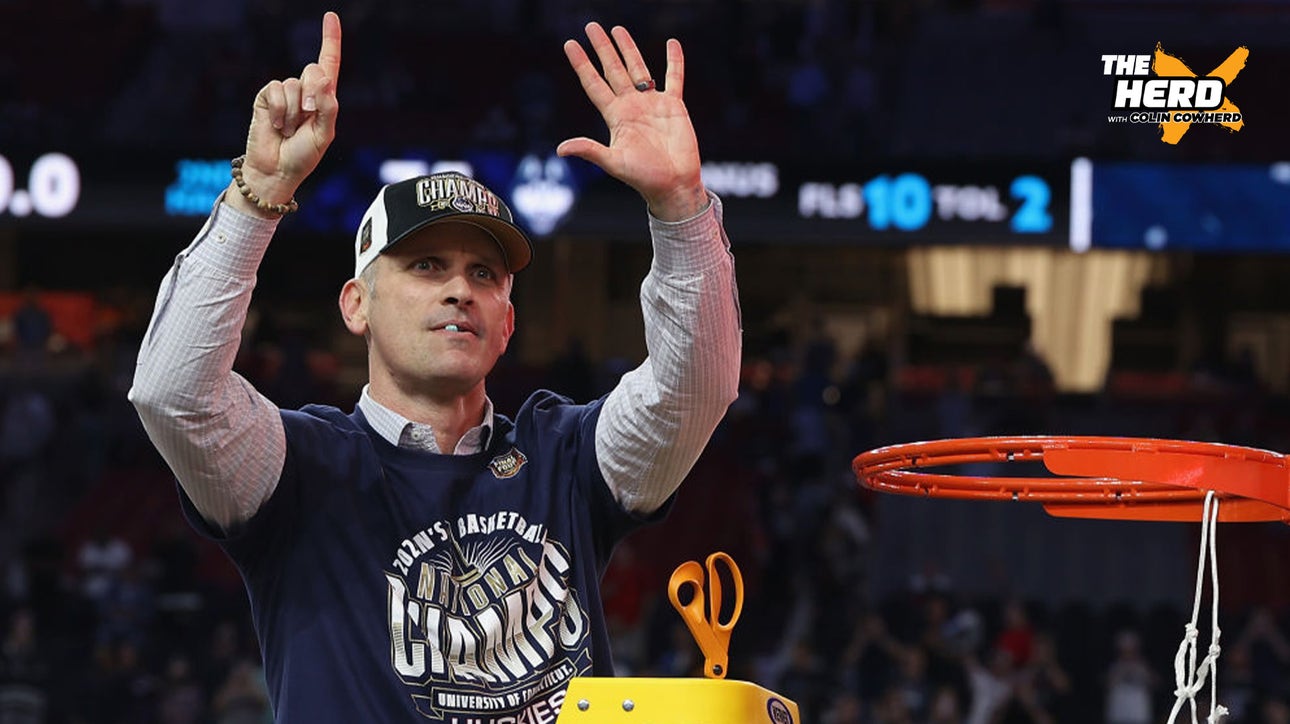
Why Dan Hurley turned down Kentucky offer to stay at UConn
5 DAYS AGO
•
FOX SPORTS
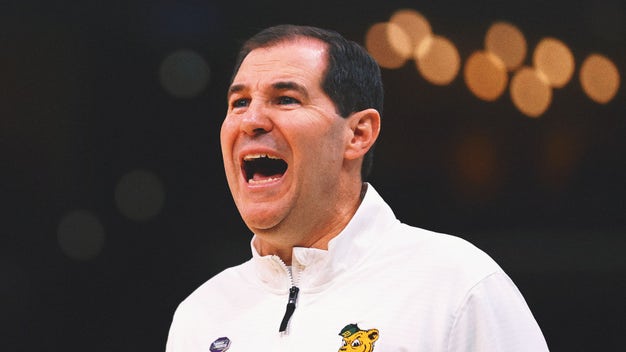
Scott Drew turns down Kentucky, will remain at Baylor
5 DAYS AGO
•
FOX SPORTS
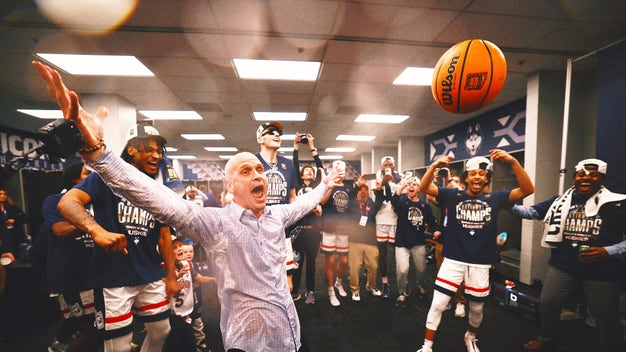
UConn's dominant title run proves that Huskies do 'run college basketball'
APRIL 9
•
FOX SPORTS
College basketball rankings: Way-too-early top 25 for the 2024-25 season
APRIL 9
•
FOX SPORTS
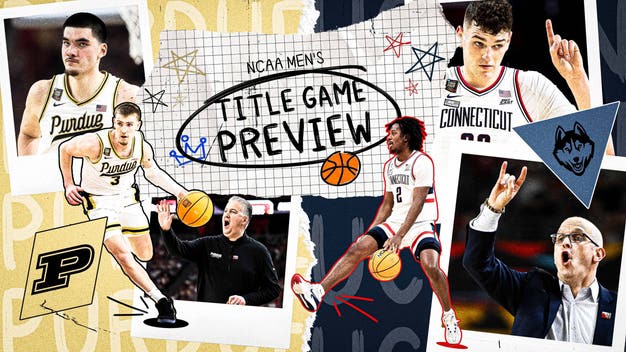
UConn, Purdue set for 'Clash of the Titans' in national championship game
APRIL 8
•
FOX SPORTS
John Calipari confirms Kentucky departure; set to become next Arkansas coach
APRIL 9
•
FOX SPORTS
MORE COLLEGE BASKETBALL NEWS
ADVERTISEMENT
FEATURED VIDEOS
MORE COLLEGE BASKETBALL VIDEOS
Dan Hurley's priority is 'going for a three-peat' with UConn | The Herd
6 DAYS AGO
•
FOX SPORTS
Will Bronny James ultimately leap to the NBA? | The Herd
APRIL 8
•
FOX SPORTS
Is Caitlin Clark the GOAT of WBB & is Bronny James ready for NBA Draft? | All Facts No Brakes
16 HOURS AGO
•
FOX SPORTS
Ice Cube offers Caitlin Clark $5M to join the BIG 3 | All Facts No Brakes
APRIL 8
•
FOX SPORTS
Ohio State Buckeyes vs. Illinois Fighting Illini 2024 Big Ten Tournament Highlights | CBB on FOX
MARCH 16
•
FOX SPORTS
MORE COLLEGE BASKETBALL VIDEOS
TOP HEADLINES
SEE MORE COLLEGE BASKETBALL NEWS
Oumar Ballo's commitment to Indiana shows program's urgency to win now
2024 college basketball transfer portal tracker: Oumar Ballo transfers to Indiana
Zach Edey's NBA future: Why is his draft stock surging, and will his game translate?
College basketball rankings: Way-too-early top 25 for the 2024-25 season
2023-24 Best college basketball players: Top 25 players in first 25 days of the season
SEE MORE COLLEGE BASKETBALL NEWS
FOLLOW NCAA COLLEGE BASKETBALL
Follow your favorites to personalize your FOX Sports experience
COLLEGE BASKETBALL VIDEOS
SEE ALL COLLEGE BASKETBALL VIDEOS
Is Caitlin Clark the GOAT of WBB & is Bronny James ready for NBA Draft? | All Facts No Brakes
16 HOURS AGO
Is Bronny James ready for the NBA competition? | The Herd
4 DAYS AGO
Bronny James' NBA readiness questioned due to size and skillset | Undisputed
4 DAYS AGO
Dan Hurley's priority is 'going for a three-peat' with UConn | The Herd
6 DAYS AGO
UConn's Purdue game plan: Donovan Clingan on Zach Edey, blanket the three | The Herd
6 DAYS AGO
Zach Edey or Donovan Clingan: which player has the higher NBA upside? | First Things First
APRIL 9
Why UConn would get 'annihilated' against all-time college basketball teams | What's Wright?
APRIL 9
Why Zach Edey will excel in the NBA | The Herd
APRIL 9
UConn is 'Oppenheimer': historic and sweeps through awards | The Herd
APRIL 9
How did UConn win back-to-back championships? | The Herd
APRIL 9
SEE ALL COLLEGE BASKETBALL VIDEOS