my favs
Access and manage your favorites here
DISMISS
Home
Scores
Watch
NFL Draft
Podcasts
Odds
Super 6
Stories
Search
Sign In
Account
SPORTS & TEAMS
PLAYERS
SHOWS
PERSONALITIES
SPORTS
SPORTS & TEAMS
PLAYERS
SHOWS
PERSONALITIES
SPORTS
NFL
NCAA FB
MLB
NBA
NCAA BK
NASCAR
Soccer
UFL
NCAAW BK
NHL
Golf
Premier Boxing Champions
WWE
UFC
WNBA
Tennis
Motor Sports
Professional Bowlers Association
Horse Racing
Westminster Kennel Club
FIBA
Olympics
World Baseball Classic
NRL
NFL
NFL
NFL
Arizona Cardinals
Atlanta Falcons
Baltimore Ravens
Buffalo Bills
Carolina Panthers
Chicago Bears
Cincinnati Bengals
Cleveland Browns
Dallas Cowboys
Denver Broncos
Detroit Lions
Green Bay Packers
Houston Texans
Indianapolis Colts
Jacksonville Jaguars
Kansas City Chiefs
Las Vegas Raiders
Los Angeles Chargers
Los Angeles Rams
Miami Dolphins
Minnesota Vikings
New England Patriots
New Orleans Saints
New York Giants
New York Jets
Philadelphia Eagles
Pittsburgh Steelers
San Francisco 49ers
Seattle Seahawks
Tampa Bay Buccaneers
Tennessee Titans
Washington Commanders
NFL
NFL
>
NFL
FEATURED
FEATURED
SCORES
STANDINGS
DRAFT
SCHEDULE
FREE AGENCY TRACKER
More
STATS
ODDS
VIDEOS
NEWS
PLAYER NEWS
INJURIES
TEAMS
SOCIAL
SUPER BOWL
EDITOR'S PICKS
MORE NFL NEWS
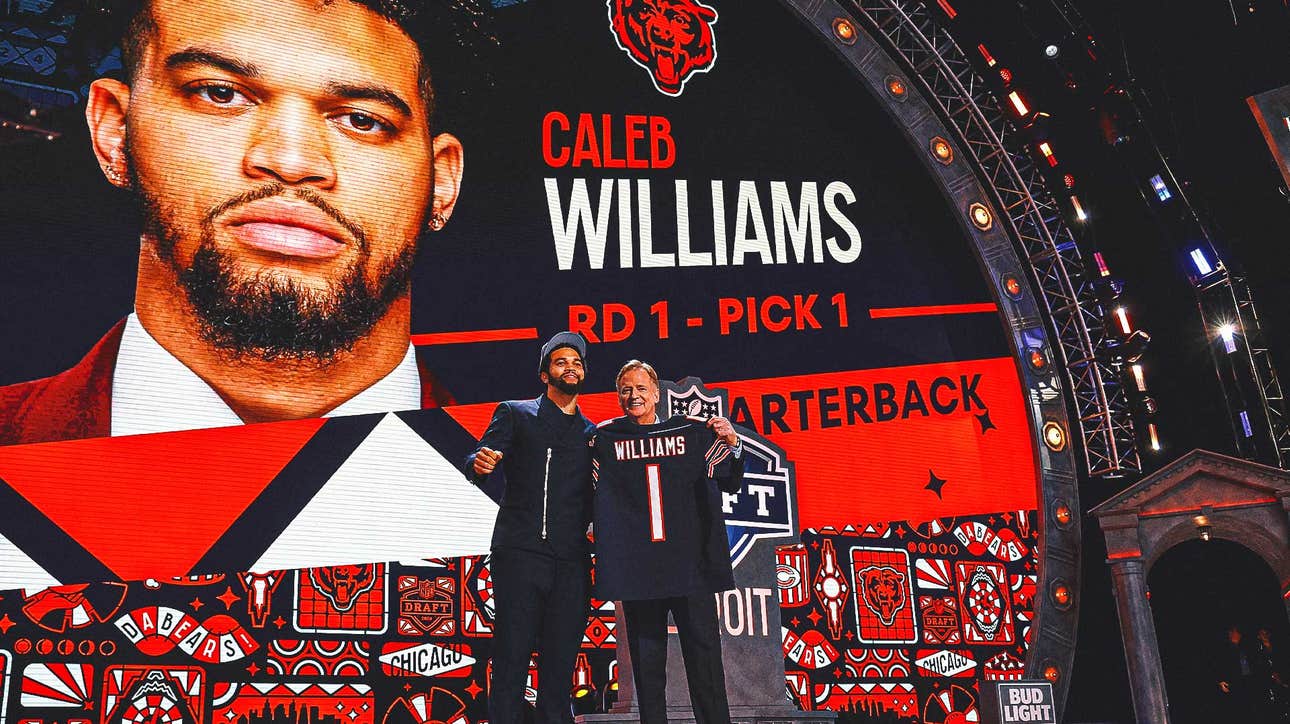
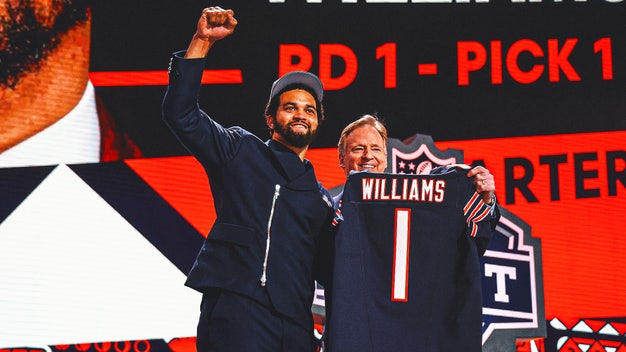
On Caleb Williams, expectations and hope for Chicago
10 HOURS AGO
•
FOX SPORTS
NFL Draft picks, grades and analysis: Bears land pair of A's for top-10 duo
7 HOURS AGO
•
FOX SPORTS
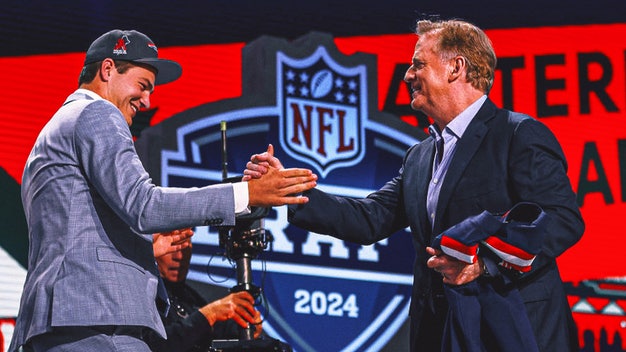
Why Falcons made stunning pick, taking QB Michael Penix Jr. at No. 8 overall
10 HOURS AGO
•
FOX SPORTS
Why Patriots QB Drake Maye couldn't be more different than Mac Jones
10 HOURS AGO
•
FOX SPORTS
NFL teams draft 6 QBs in top 12 — among several records set
7 HOURS AGO
•
FOX SPORTS
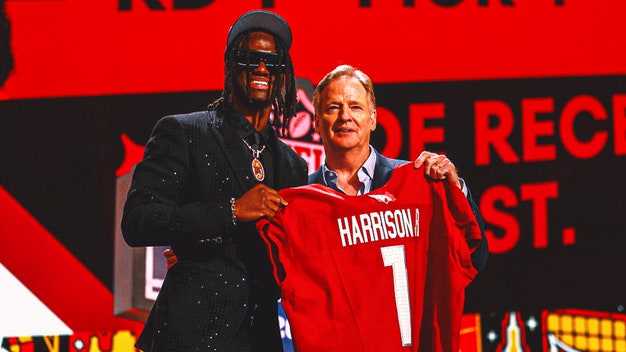
Cardinals' 'Batman' Kyler Murray finds his 'Robin' in Marvin Harrison Jr.
9 HOURS AGO
•
FOX SPORTS
2024 NFL Draft live updates, picks tracker
7 HOURS AGO
•
FOX SPORTS
MORE NFL NEWS
ADVERTISEMENT
TRENDING VIDEOS
MORE NFL VIDEOS
Rome Odunze Highlights | CFB on FOX
FEBRUARY 24
•
FOX SPORTS
Quinn Ewers throws a 42-yard DOT to Xavier Worthy as Texas extends lead over Houston
OCTOBER 21, 2023
•
FOX SPORTS
Marvin Harrison Jr. Highlights | CFB on FOX
FEBRUARY 24
•
FOX SPORTS
LSU HC Brian Kelly on what makes Jayden Daniels so special | The Herd
2 DAYS AGO
•
FOX SPORTS
Michael Penix Jr. STUNS NFL Draft, 6 QBs drafted in first round - Dave Helman | NFL on FOX Pod
9 HOURS AGO
•
FOX SPORTS
MORE NFL VIDEOS
TOP HEADLINES
SEE MORE NFL NEWS
NFL Draft picks, grades and analysis: Bears land pair of A's for top-10 duo
Falcons notified Kirk Cousins of Michael Penix Jr. pick while on the clock
NFL teams draft 6 QBs in top 12 — among several records set
Why Falcons made stunning pick, taking QB Michael Penix Jr. at No. 8 overall
Atlanta Falcons select Michael Penix with No. 8 overall pick in 2024 Draft
SEE MORE NFL NEWS
WIN YOUR SHARE OF $10,000 IN WEEKLY CASH PRIZES
Enter your NFL game predictions every week to win big.
BETTING INSIGHTS
MORE NFL BETTING INSIGHTS
2024 NFL Draft odds: Who is going in the top 10?
12 HOURS AGO
•
FOX SPORTS
Bettor places $100k bet on Caleb Williams to go No. 1 in 2024 NFL Draft
15 HOURS AGO
•
FOX SPORTS
2024 NFL Draft odds: Raiders favored to select Michael Penix Jr.
19 HOURS AGO
•
FOX SPORTS
MORE NFL BETTING INSIGHTS
FOLLOW THE NFL
Follow your favorites to personalize your FOX Sports experience
NFL VIDEOS
Best fits of the 2024 NFL Draft ft. Xavier Worthy, Terrior Arnold & more! | NFL on FOX Pod
3 HOURS AGO
Will Sean Payton, Denver Broncos REGRET drafting Bo Nix? | NFL on FOX Pod
3 HOURS AGO
Did the Atlanta Falcons make a HUGE mistake drafting Michael Penix Jr.? | NFL on FOX Pod
3 HOURS AGO
Biggest winner & best value pick from the 1st round of the NFL Draft | NFL on FOX Pod
3 HOURS AGO
Michael Penix Jr. STUNS NFL Draft, 6 QBs drafted in first round - Dave Helman | NFL on FOX Pod
9 HOURS AGO
Why Patriots, Raiders, Broncos are under the most pressure in the 2024 NFL Draft | Speak
13 HOURS AGO
Caleb Williams headlines the Under Duress List ahead of the 2024 NFL Draft | First Things First
13 HOURS AGO
Should the 49ers draft Brandon Aiyuk’s replacement? | Speak
14 HOURS AGO
Who is a must-draft player for the Cowboys? | First Things First
14 HOURS AGO
Rams reportedly eyeing a trade into the Top 10 | The Herd
14 HOURS AGO
FOX NFL SUNDAY VIDEOS
SEE ALL FOX NFL SUNDAY VIDEOS
Rob Gronkowski's Best Moments of the 2023-24 NFL Season | NFL on FOX
FEBRUARY 24
'NFL on FOX' crew react to Brock Purdy, 49ers victory over Lions in NFC Championship | NFL on FOX
JANUARY 29
'They know how to dial it up' – Gronk gives praise to Patrick Mahomes, Chiefs after clinching Super Bowl appearance | NFL on FOX
JANUARY 29
Dan Campbell and the Lions are ready to make waves in the NFC Championship game | FOX NFL Sunday
JANUARY 28
Green Bay Packers' key players heading into Divisional round vs. 49ers | FOX NFL Sunday
JANUARY 21
San Francisco 49ers' key players heading into Divisional round vs. Packers | FOX NFL Sunday
JANUARY 21
'Just go win' – Jordan Love discusses 49ers matchup, becoming Packers' QB1, and more | FOX NFL Sunday
JANUARY 21
John Lynch and Kyle Shanahan have built 49ers into a strong Super Bowl contender | FOX NFL Sunday
JANUARY 21
Will Mike McCarthy remain head coach of Cowboys after upset loss to Packers? | FOX NFL Sunday
JANUARY 15
'NFL on FOX' crew react to Packers' SHOCKING upset victory over the Cowboys | FOX NFL Sunday
JANUARY 15
SEE ALL FOX NFL SUNDAY VIDEOS
FOX NFL KICKOFF VIDEOS
SEE ALL FOX NFL KICKOFF VIDEOS
Ravens' Lamar Jackson & 49ers' Christian McCaffrey among 2023 'The Kickies' Award winners
JANUARY 7
Rob Gronkowski and Julian Edelman reflect on Bill Belichick's potential Patriots exit | FOX NFL Kickoff
JANUARY 7
Is Michigan's Jim Harbaugh coming back to the NFL? Will the Raiders keep Antonio Pierce? | FOX NFL Kickoff
JANUARY 7
How Sean McVay and the Rams are finding success with late draft picks | FOX NFL Kickoff
JANUARY 7
What concerns do Eagles and 49ers face heading into the playoffs? | FOX NFL Kickoff
DECEMBER 31, 2023
Dean Blandino and 'FOX NFL Kickoff' crew break down the controversial call in Lions vs. Cowboys | FOX NFL Kickoff
DECEMBER 31, 2023
Are Patrick Mahomes and the Chiefs a dynasty? | FOX NFL Kickoff
DECEMBER 17, 2023
What's a successful season for the Cowboys? | FOX NFL Kickoff
DECEMBER 17, 2023
Rob Gronkowski & Julian Edelman discuss if Patriots HC Bill Belichick will be back next season? | FOX NFL Kickoff
DECEMBER 10, 2023
Jaguars' Trevor Lawrence leaning toward playing and more updates around the league | FOX NFL Kickoff
DECEMBER 10, 2023
SEE ALL FOX NFL KICKOFF VIDEOS