my favs
Access and manage your favorites here
DISMISS
Home
Scores
Watch
Podcasts
Odds
Super 6
Stories
Search
Sign In
Account
SPORTS & TEAMS
PLAYERS
SHOWS
PERSONALITIES
SPORTS
SPORTS & TEAMS
PLAYERS
SHOWS
PERSONALITIES
SPORTS
NFL
NCAA FB
MLB
NBA
NCAA BK
NASCAR
Soccer
UFL
NCAAW BK
NHL
Golf
Premier Boxing Champions
WWE
UFC
WNBA
Tennis
Motor Sports
Professional Bowlers Association
Horse Racing
Westminster Kennel Club
FIBA
Olympics
World Baseball Classic
NRL
NFL
NFL
NFL
Arizona Cardinals
Atlanta Falcons
Baltimore Ravens
Buffalo Bills
Carolina Panthers
Chicago Bears
Cincinnati Bengals
Cleveland Browns
Dallas Cowboys
Denver Broncos
Detroit Lions
Green Bay Packers
Houston Texans
Indianapolis Colts
Jacksonville Jaguars
Kansas City Chiefs
Las Vegas Raiders
Los Angeles Chargers
Los Angeles Rams
Miami Dolphins
Minnesota Vikings
New England Patriots
New Orleans Saints
New York Giants
New York Jets
Philadelphia Eagles
Pittsburgh Steelers
San Francisco 49ers
Seattle Seahawks
Tampa Bay Buccaneers
Tennessee Titans
Washington Commanders
NFL
NFL
>
NFL
FEATURED
FEATURED
SCORES
STANDINGS
DRAFT
SCHEDULE
FREE AGENCY TRACKER
More
STATS
ODDS
VIDEOS
NEWS
PLAYER NEWS
INJURIES
TEAMS
SOCIAL
SUPER BOWL
EDITOR'S PICKS
MORE NFL NEWS
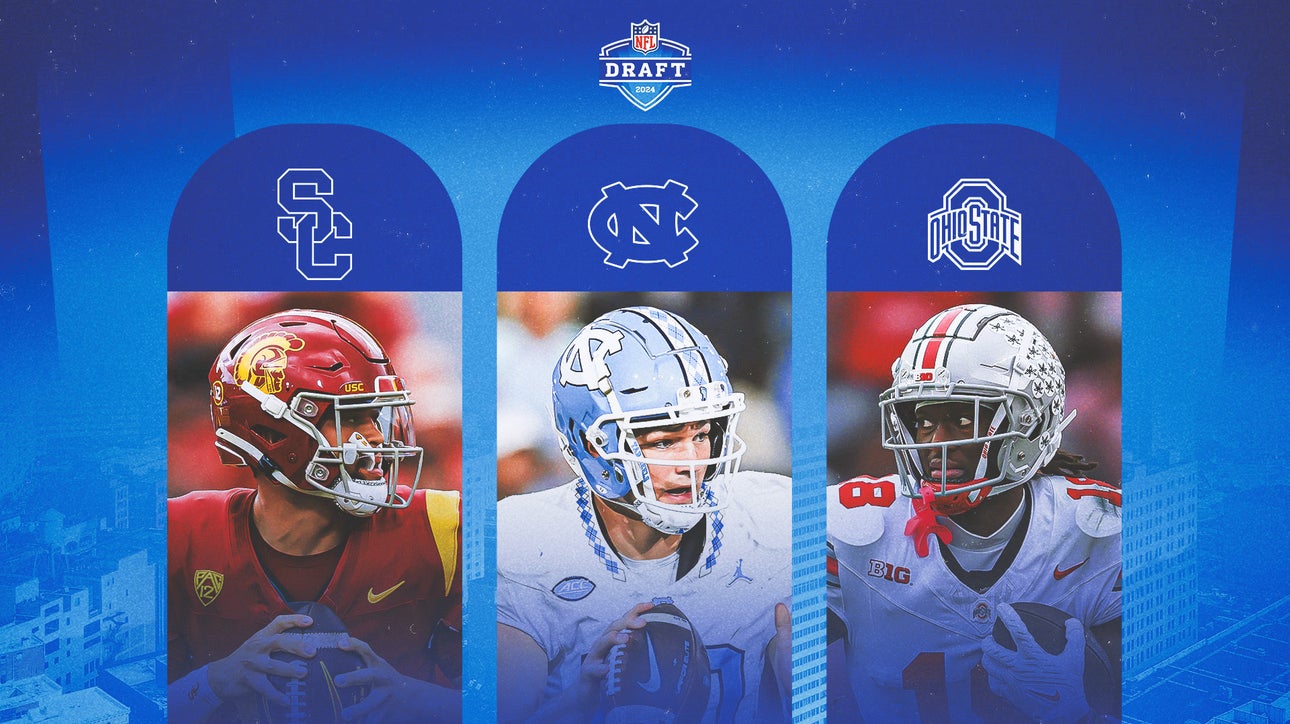
2024 NFL Draft prospect rankings: Top 100 led by Caleb Williams
3 DAYS AGO
•
FOX SPORTS
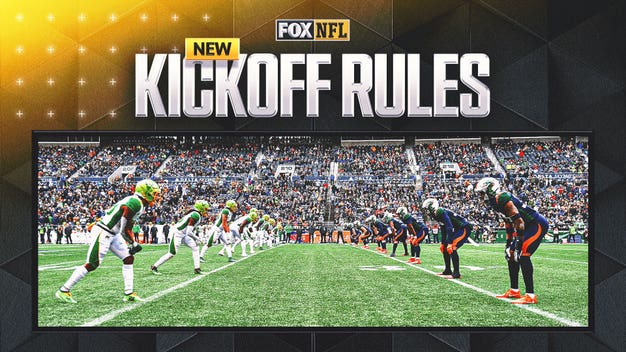
How to succeed with NFL's new kickoff format? XFL coaches share their secrets
2 DAYS AGO
•
FOX SPORTS
Daniel Jones insists he's the right QB for Giants, and why a QB controversy would be bad
3 DAYS AGO
•
FOX SPORTS
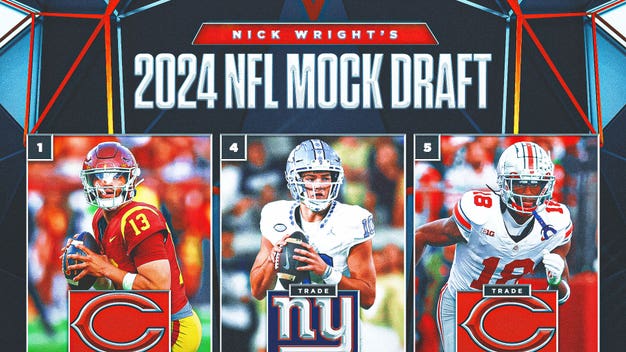
NFL mock draft: Nick Wright has Bears pair Caleb Williams, Marvin Harrison Jr.
3 DAYS AGO
•
FOX SPORTS
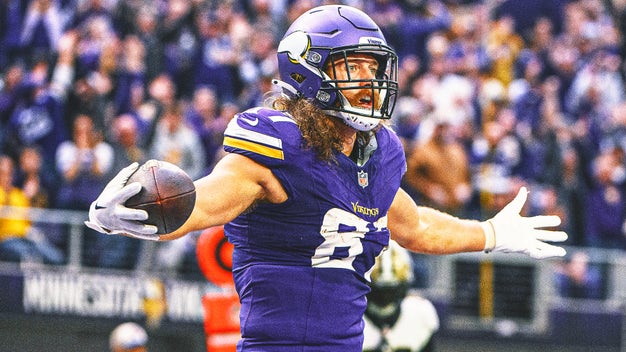
T.J. Hockenson is recovering from an ACL repair and hoping the NFL outlaws the low hit that hurt him
3 DAYS AGO
•
FOX SPORTS
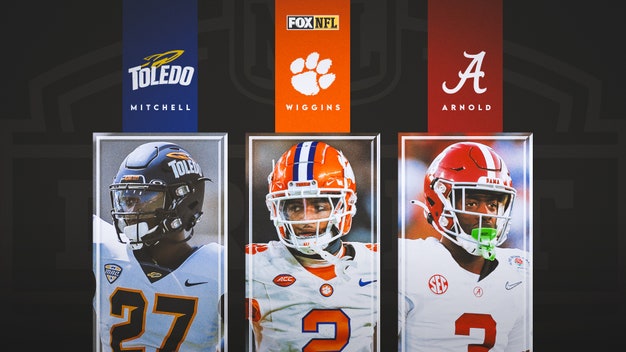
2024 NFL Draft CB rankings: 5 first-round grades among top 10 prospects
APRIL 11
•
FOX SPORTS
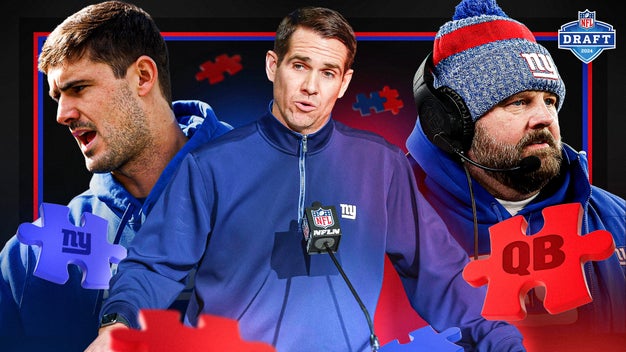
How the Giants' looming QB decision could shake the franchise to its core
APRIL 11
•
FOX SPORTS
MORE NFL NEWS
ADVERTISEMENT
TRENDING VIDEOS
MORE NFL VIDEOS
Could Giants trade up for J.J. McCarthy? | The Herd
1 DAY AGO
•
FOX SPORTS
Biggest NFL Draft sleepers and reachers to watch out for | NFL on FOX Pod
APRIL 11
•
FOX SPORTS
Chiefs GM Brett Veach describes NFL Draft strategy, biggest draft miss, Patrick Mahomes & more
18 HOURS AGO
•
FOX SPORTS
Johnny Manziel previews NFL Draft QB prospects: Williams, Daniels, McCarthy & Maye | Undisputed
APRIL 10
•
FOX SPORTS
Colin's Mock Draft 2.0: Bo Nix to Denver, J.J. McCarthy-Vikings, Rome Odunze to Jets | The Herd
11 HOURS AGO
•
FOX SPORTS
MORE NFL VIDEOS
TOP HEADLINES
SEE MORE NFL NEWS
2024 NFL Mock Draft: Chargers, Giants land star wideouts after QBs go 1-4
Dwight Freeney says Tom Brady was one of the toughest NFL QBs for him to sack
2024 NFL jersey redesigns: Browns latest team to make change
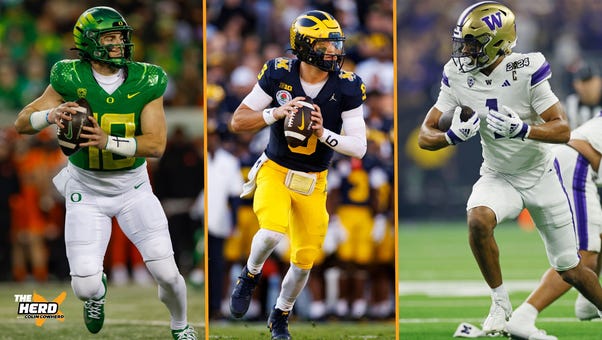
2024 NFL Draft: Can Michigan break Georgia's record for most players drafted?
Why is this year's QB draft class so valued? Hint: An underwhelming 2025 group
SEE MORE NFL NEWS
WIN YOUR SHARE OF $10,000 IN WEEKLY CASH PRIZES
Enter your NFL game predictions every week to win big.
BETTING INSIGHTS
MORE NFL BETTING INSIGHTS
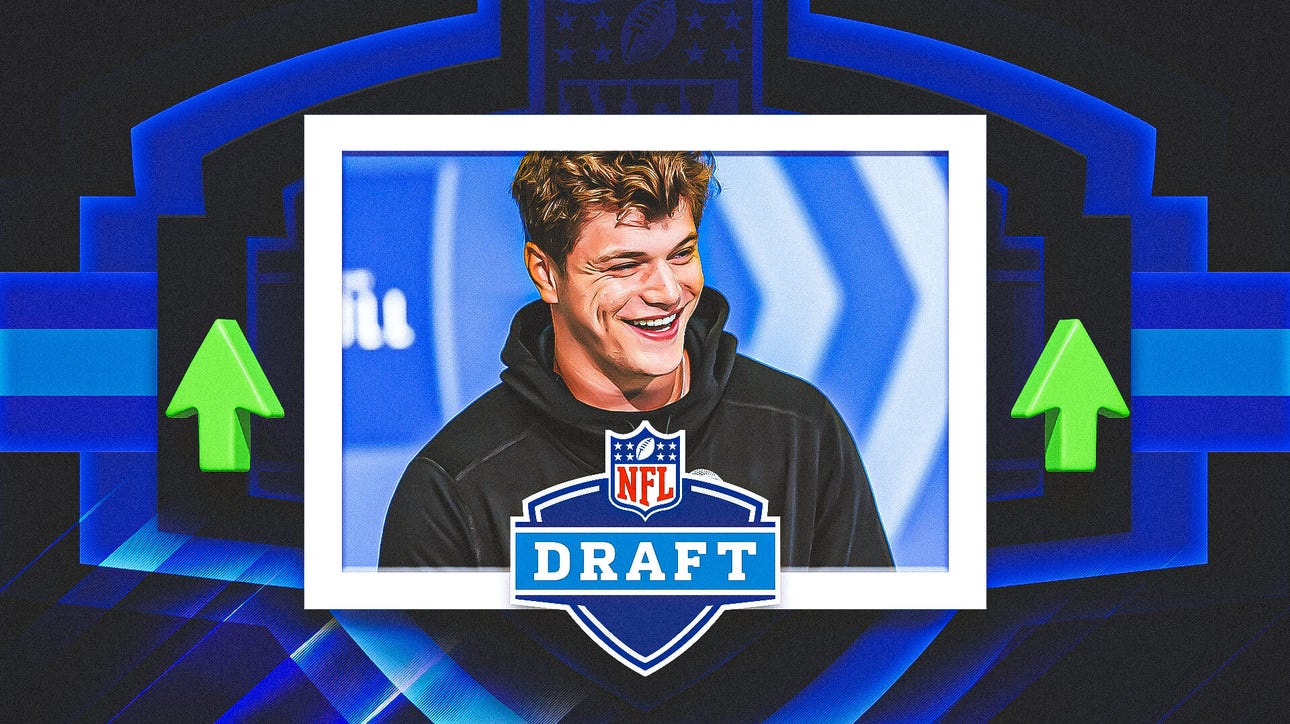
2024 NFL Draft odds: Vikings, Patriots are clear favorites to draft J.J. McCarthy
15 HOURS AGO
•
FOX SPORTS
2024 NFL Draft could set record for most first-round picks on offense
16 HOURS AGO
•
FOX SPORTS
Wager on J.J. McCarthy to go No. 4 in NFL Draft, other best bets
1 DAY AGO
•
FOX SPORTS
MORE NFL BETTING INSIGHTS
FOLLOW THE NFL
Follow your favorites to personalize your FOX Sports experience
NFL VIDEOS
NFL scout says Caleb Williams is 'most likely' to become Hall of Famer in 2024 QB class | Speak
8 HOURS AGO
Could Bill Belichick be the next Bills coach? | First Things First
10 HOURS AGO
Colin's Mock Draft 2.0: Bo Nix to Denver, J.J. McCarthy-Vikings, Rome Odunze to Jets | The Herd
11 HOURS AGO
Which QB prospect should the Patriots select? | The Herd
12 HOURS AGO
Cowboys may be Bill Belichick’s only suitor, per report | Undisputed
13 HOURS AGO
Skip picks the Eagles as NFC East champions and says his Cowboys will miss the playoffs
14 HOURS AGO
Should the Giants trade up for J.J. McCarthy? | The Carton Show
14 HOURS AGO
Chiefs GM Brett Veach describes NFL Draft strategy, biggest draft miss, Patrick Mahomes & more
18 HOURS AGO
Dwight Freeney describes the emotions of entering the NFL Hall of Fame | NFL on FOX Pod
1 DAY AGO
Could Giants trade up for J.J. McCarthy? | The Herd
1 DAY AGO
FOX NFL SUNDAY VIDEOS
SEE ALL FOX NFL SUNDAY VIDEOS
Rob Gronkowski's Best Moments of the 2023-24 NFL Season | NFL on FOX
FEBRUARY 24
'NFL on FOX' crew react to Brock Purdy, 49ers victory over Lions in NFC Championship | NFL on FOX
JANUARY 29
'They know how to dial it up' – Gronk gives praise to Patrick Mahomes, Chiefs after clinching Super Bowl appearance | NFL on FOX
JANUARY 29
Dan Campbell and the Lions are ready to make waves in the NFC Championship game | FOX NFL Sunday
JANUARY 28
Green Bay Packers' key players heading into Divisional round vs. 49ers | FOX NFL Sunday
JANUARY 21
San Francisco 49ers' key players heading into Divisional round vs. Packers | FOX NFL Sunday
JANUARY 21
'Just go win' – Jordan Love discusses 49ers matchup, becoming Packers' QB1, and more | FOX NFL Sunday
JANUARY 21
John Lynch and Kyle Shanahan have built 49ers into a strong Super Bowl contender | FOX NFL Sunday
JANUARY 21
Will Mike McCarthy remain head coach of Cowboys after upset loss to Packers? | FOX NFL Sunday
JANUARY 15
'NFL on FOX' crew react to Packers' SHOCKING upset victory over the Cowboys | FOX NFL Sunday
JANUARY 15
SEE ALL FOX NFL SUNDAY VIDEOS
FOX NFL KICKOFF VIDEOS
SEE ALL FOX NFL KICKOFF VIDEOS
Ravens' Lamar Jackson & 49ers' Christian McCaffrey among 2023 'The Kickies' Award winners
JANUARY 7
Rob Gronkowski and Julian Edelman reflect on Bill Belichick's potential Patriots exit | FOX NFL Kickoff
JANUARY 7
Is Michigan's Jim Harbaugh coming back to the NFL? Will the Raiders keep Antonio Pierce? | FOX NFL Kickoff
JANUARY 7
How Sean McVay and the Rams are finding success with late draft picks | FOX NFL Kickoff
JANUARY 7
What concerns do Eagles and 49ers face heading into the playoffs? | FOX NFL Kickoff
DECEMBER 31, 2023
Dean Blandino and 'FOX NFL Kickoff' crew break down the controversial call in Lions vs. Cowboys | FOX NFL Kickoff
DECEMBER 31, 2023
Are Patrick Mahomes and the Chiefs a dynasty? | FOX NFL Kickoff
DECEMBER 17, 2023
What's a successful season for the Cowboys? | FOX NFL Kickoff
DECEMBER 17, 2023
Rob Gronkowski & Julian Edelman discuss if Patriots HC Bill Belichick will be back next season? | FOX NFL Kickoff
DECEMBER 10, 2023
Jaguars' Trevor Lawrence leaning toward playing and more updates around the league | FOX NFL Kickoff
DECEMBER 10, 2023
SEE ALL FOX NFL KICKOFF VIDEOS