my favs
Access and manage your favorites here
DISMISS
Home
Scores
Watch
Podcasts
Odds
Super 6
Stories
Search
Sign In
Account
SPORTS & TEAMS
PLAYERS
SHOWS
PERSONALITIES
SPORTS
SPORTS & TEAMS
PLAYERS
SHOWS
PERSONALITIES
SPORTS
NFL
NCAA FB
MLB
NBA
NCAA BK
NASCAR
Soccer
UFL
NCAAW BK
NHL
Golf
Premier Boxing Champions
WWE
UFC
WNBA
Tennis
Motor Sports
Professional Bowlers Association
Horse Racing
Westminster Kennel Club
FIBA
Olympics
World Baseball Classic
NRL
NFL
NFL
NFL
Arizona Cardinals
Atlanta Falcons
Baltimore Ravens
Buffalo Bills
Carolina Panthers
Chicago Bears
Cincinnati Bengals
Cleveland Browns
Dallas Cowboys
Denver Broncos
Detroit Lions
Green Bay Packers
Houston Texans
Indianapolis Colts
Jacksonville Jaguars
Kansas City Chiefs
Las Vegas Raiders
Los Angeles Chargers
Los Angeles Rams
Miami Dolphins
Minnesota Vikings
New England Patriots
New Orleans Saints
New York Giants
New York Jets
Philadelphia Eagles
Pittsburgh Steelers
San Francisco 49ers
Seattle Seahawks
Tampa Bay Buccaneers
Tennessee Titans
Washington Commanders
NFL
NFL
>
NFL
FEATURED
FEATURED
SCORES
STANDINGS
DRAFT
SCHEDULE
FREE AGENCY TRACKER
More
STATS
ODDS
VIDEOS
NEWS
PLAYER NEWS
INJURIES
TEAMS
SOCIAL
SUPER BOWL
SCHEDULE RELEASE
EDITOR'S PICKS
MORE NFL NEWS
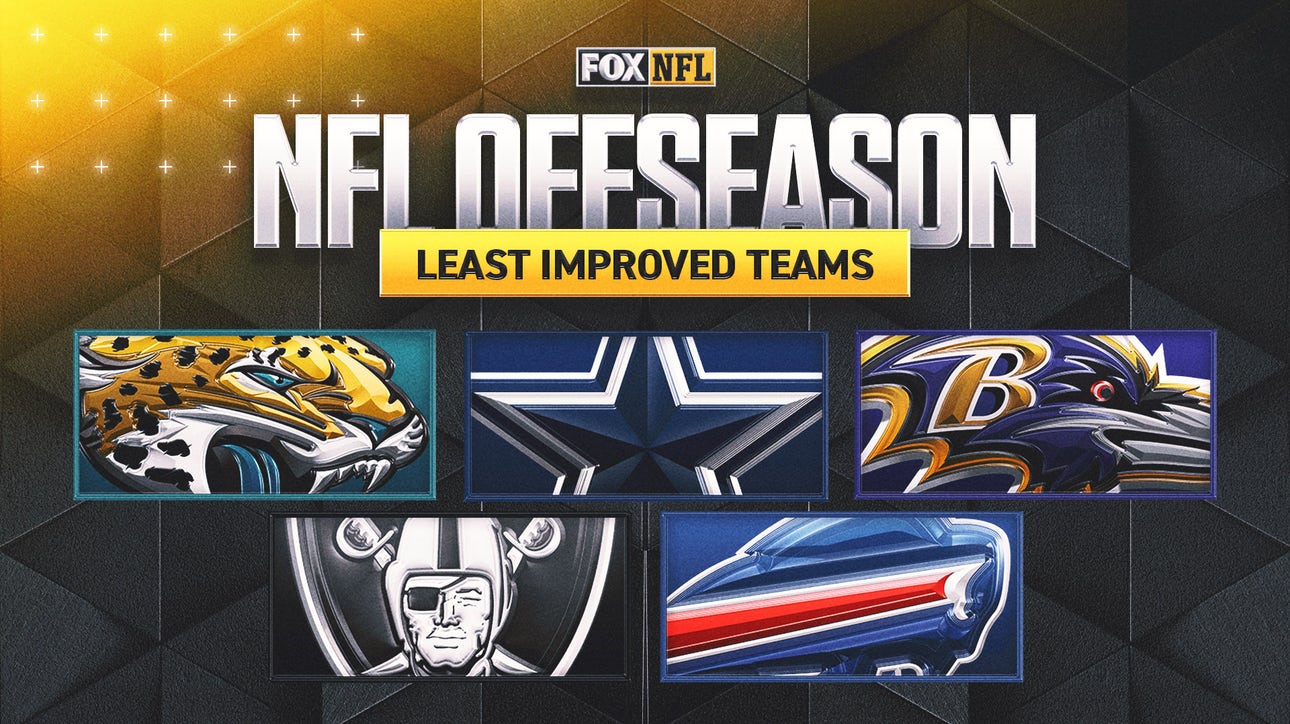
NFL's 5 least improved teams of the offseason: Cowboys or Bills more disappointing?
1 DAY AGO
•
FOX SPORTS
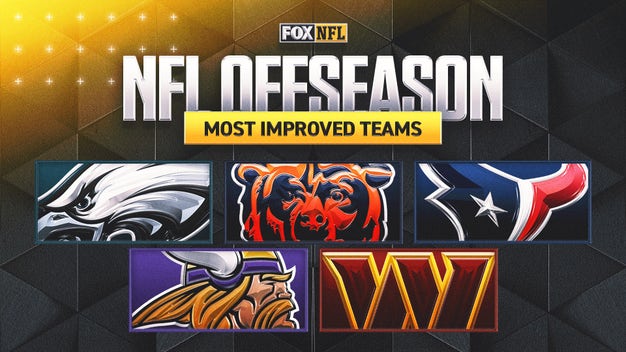
NFL's 5 most improved teams of the offseason
1 DAY AGO
•
FOX SPORTS
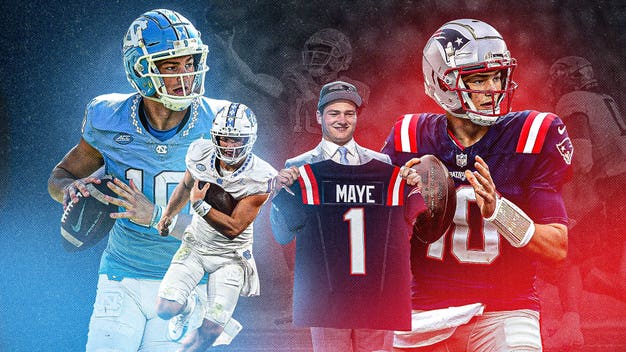
How Patriots QB Drake Maye's family shaped him to meet this moment
1 DAY AGO
•
FOX SPORTS
Why Titans first-round pick JC Latham can be ‘an All-Pro before you know it’
2 DAYS AGO
•
FOX SPORTS
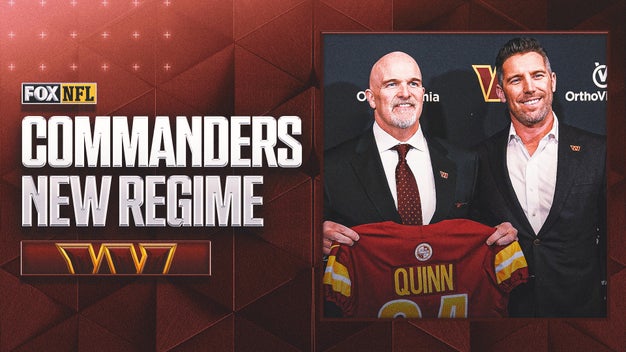
Taking Command: How Adam Peters is reshaping football in Washington
2 DAYS AGO
•
FOX SPORTS
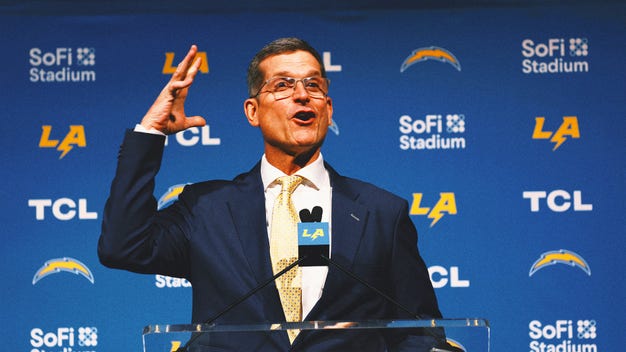
How Chargers’ WR remake reveals Jim Harbaugh’s organizational shift
2 DAYS AGO
•
FOX SPORTS
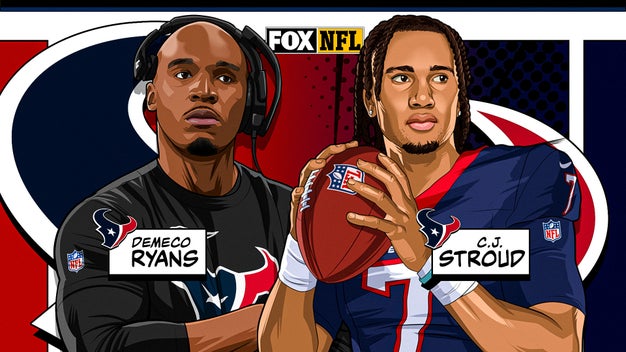
Texans are NFL’s most-hyped team this offseason. Are they ready to deliver?
3 DAYS AGO
•
FOX SPORTS
MORE NFL NEWS
ADVERTISEMENT
TRENDING VIDEOS
MORE NFL VIDEOS
Why Jared Goff deserves an extension over Tua Tagovailoa | The Herd
8 HOURS AGO
•
FOX SPORTS
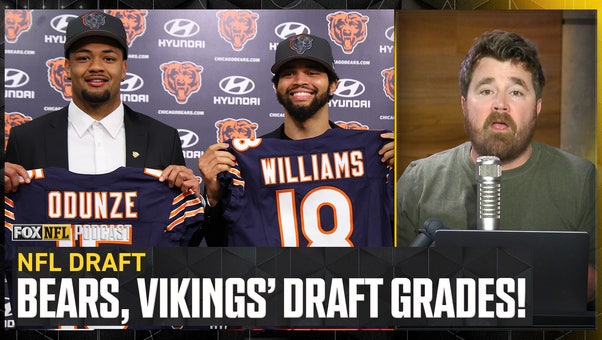
Grading the Chicago Bears, Minnesota Vikings' NFL Draft picks | NFL on FOX Pod
APRIL 29
•
FOX SPORTS
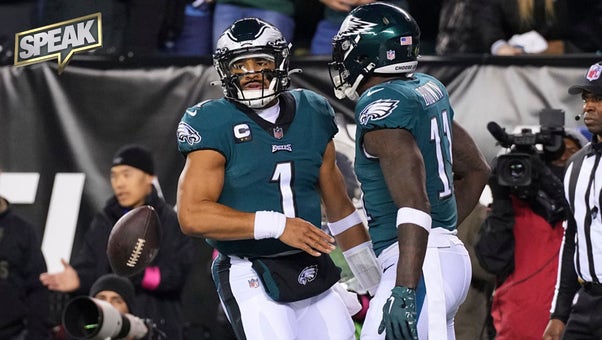
Can the Eagles bounce back from their 2024 Wild Card loss vs. Bucs? | Speak
MAY 1
•
FOX SPORTS
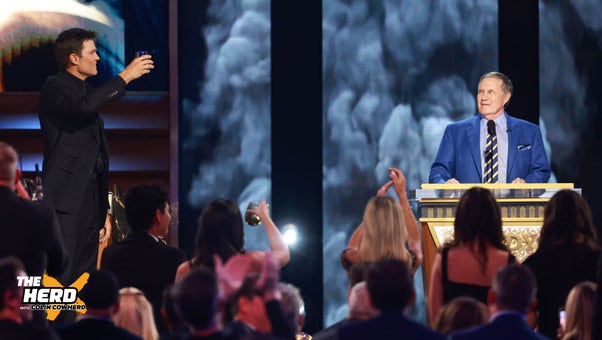
What is the current state of Tom Brady and Bill Belichick's relationship? | The Herd
1 DAY AGO
•
FOX SPORTS
Caleb Williams officially named the Bears starting QB | The Herd
9 HOURS AGO
•
FOX SPORTS
MORE NFL VIDEOS
TOP HEADLINES
SEE MORE NFL NEWS
2024 NFL Schedule Release: Date, when does the season start?
Raiders GM Tom Telesco: Aidan O'Connell, Gardner Minshew will compete to be QB1
NFL's 5 least improved teams of the offseason: Cowboys or Bills more disappointing?
2024-25 NFL MVP odds: Patrick Mahomes, Josh Allen early favorites
NFL's 5 most improved teams of the offseason
SEE MORE NFL NEWS
WIN YOUR SHARE OF $10,000 IN WEEKLY CASH PRIZES
Enter your NFL game predictions every week to win big.
BETTING INSIGHTS
MORE NFL BETTING INSIGHTS
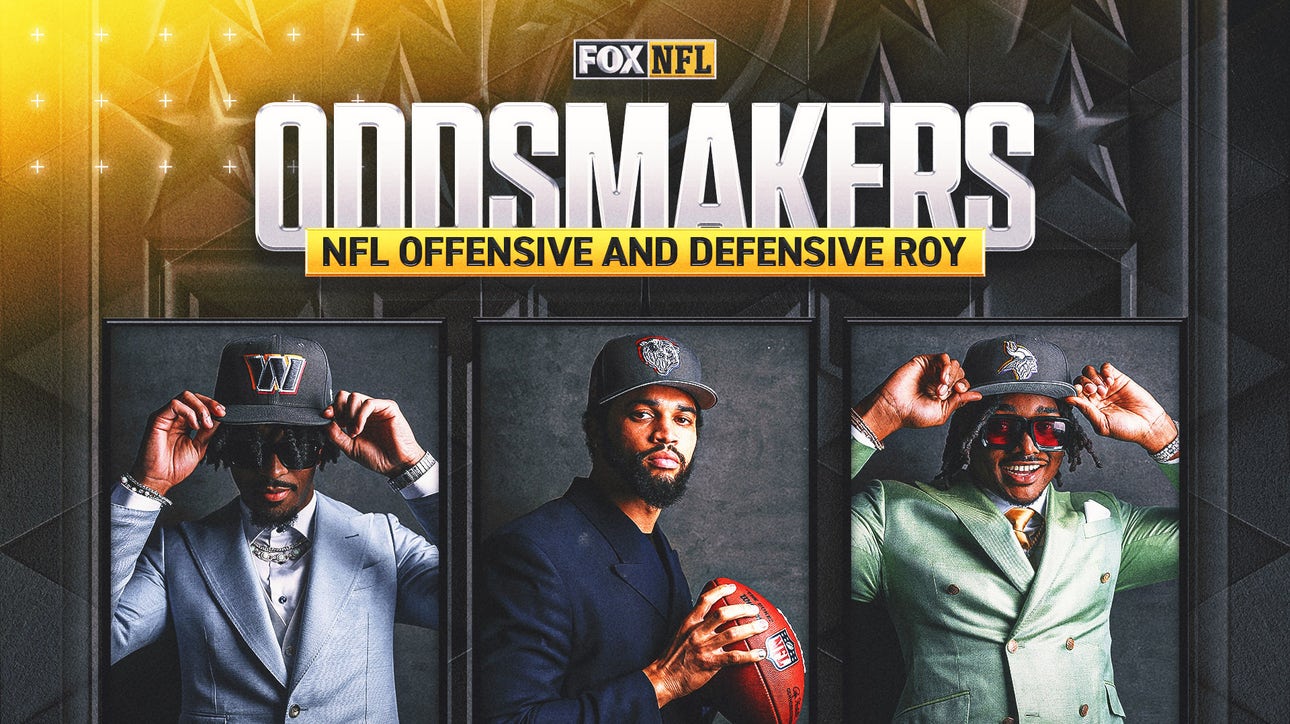
NFL Rookie of the Year action report: 'It’s a volatile market with the rookies'
1 DAY AGO
•
FOX SPORTS
2024-25 NFL MVP odds: Patrick Mahomes, Josh Allen early favorites
1 DAY AGO
•
FOX SPORTS
Caleb Williams, Bears shaking up the odds: 'Their ceiling is high if he excels'
2 DAYS AGO
•
FOX SPORTS
MORE NFL BETTING INSIGHTS
FOLLOW THE NFL
Follow your favorites to personalize your FOX Sports experience
NFL VIDEOS
Will Dak Prescott still be the Cowboys’ QB in 2025? Skip answers: | The Skip Bayless Show
6 HOURS AGO
Keyshawn & Jayden Daniels share the weirdest questions asked at NFL Combine | All Facts No Brakes
7 HOURS AGO
Jayden Daniels plans to "out do" C.J. Stroud's historic rookie season | All Facts No Brakes
8 HOURS AGO
Why Jared Goff deserves an extension over Tua Tagovailoa | The Herd
8 HOURS AGO
Caleb Williams officially named the Bears starting QB | The Herd
9 HOURS AGO
Jayden Daniels' Arizona State teammates trashed him in viral online video | All Facts No Brakes
11 HOURS AGO
Keyshawn couldn't believe Jayden Daniels’ training regime: “What the H*** is VR?” | All Facts No Brakes
11 HOURS AGO
Jayden Daniels on transition from ASU to LSU: "They live eat & sleep football" | All Facts No Brakes
11 HOURS AGO
Jayden Daniels wants to turn around Commanders, talks Pre-Draft Process & Kingsbury | All Facts No Brakes
11 HOURS AGO
Jayden Daniels $10K bet with LSU teammate & Giants WR Malik Nabers | All Facts No Brakes
11 HOURS AGO
FOX NFL SUNDAY VIDEOS
SEE ALL FOX NFL SUNDAY VIDEOS
Rob Gronkowski's Best Moments of the 2023-24 NFL Season | NFL on FOX
FEBRUARY 24
'NFL on FOX' crew react to Brock Purdy, 49ers victory over Lions in NFC Championship | NFL on FOX
JANUARY 29
'They know how to dial it up' – Gronk gives praise to Patrick Mahomes, Chiefs after clinching Super Bowl appearance | NFL on FOX
JANUARY 29
Dan Campbell and the Lions are ready to make waves in the NFC Championship game | FOX NFL Sunday
JANUARY 28
Green Bay Packers' key players heading into Divisional round vs. 49ers | FOX NFL Sunday
JANUARY 21
San Francisco 49ers' key players heading into Divisional round vs. Packers | FOX NFL Sunday
JANUARY 21
'Just go win' – Jordan Love discusses 49ers matchup, becoming Packers' QB1, and more | FOX NFL Sunday
JANUARY 21
John Lynch and Kyle Shanahan have built 49ers into a strong Super Bowl contender | FOX NFL Sunday
JANUARY 21
Will Mike McCarthy remain head coach of Cowboys after upset loss to Packers? | FOX NFL Sunday
JANUARY 15
'NFL on FOX' crew react to Packers' SHOCKING upset victory over the Cowboys | FOX NFL Sunday
JANUARY 15
SEE ALL FOX NFL SUNDAY VIDEOS
FOX NFL KICKOFF VIDEOS
SEE ALL FOX NFL KICKOFF VIDEOS
Ravens' Lamar Jackson & 49ers' Christian McCaffrey among 2023 'The Kickies' Award winners
JANUARY 7
Rob Gronkowski and Julian Edelman reflect on Bill Belichick's potential Patriots exit | FOX NFL Kickoff
JANUARY 7
Is Michigan's Jim Harbaugh coming back to the NFL? Will the Raiders keep Antonio Pierce? | FOX NFL Kickoff
JANUARY 7
How Sean McVay and the Rams are finding success with late draft picks | FOX NFL Kickoff
JANUARY 7
What concerns do Eagles and 49ers face heading into the playoffs? | FOX NFL Kickoff
DECEMBER 31, 2023
Dean Blandino and 'FOX NFL Kickoff' crew break down the controversial call in Lions vs. Cowboys | FOX NFL Kickoff
DECEMBER 31, 2023
Are Patrick Mahomes and the Chiefs a dynasty? | FOX NFL Kickoff
DECEMBER 17, 2023
What's a successful season for the Cowboys? | FOX NFL Kickoff
DECEMBER 17, 2023
Rob Gronkowski & Julian Edelman discuss if Patriots HC Bill Belichick will be back next season? | FOX NFL Kickoff
DECEMBER 10, 2023
Jaguars' Trevor Lawrence leaning toward playing and more updates around the league | FOX NFL Kickoff
DECEMBER 10, 2023
SEE ALL FOX NFL KICKOFF VIDEOS