my favs
Access and manage your favorites here
DISMISS
Home
Scores
Watch
NFL Draft
Podcasts
Odds
Super 6
Stories
Search
Sign In
Account
SPORTS & TEAMS
PLAYERS
SHOWS
PERSONALITIES
SPORTS
SPORTS & TEAMS
PLAYERS
SHOWS
PERSONALITIES
SPORTS
NFL
NCAA FB
MLB
NBA
NCAA BK
NASCAR
Soccer
UFL
NCAAW BK
NHL
Golf
Premier Boxing Champions
WWE
UFC
WNBA
Tennis
Motor Sports
Professional Bowlers Association
Horse Racing
Westminster Kennel Club
FIBA
Olympics
World Baseball Classic
NRL
NBA
NBA
NBA
Atlanta Hawks
Boston Celtics
Brooklyn Nets
Charlotte Hornets
Chicago Bulls
Cleveland Cavaliers
Dallas Mavericks
Denver Nuggets
Detroit Pistons
Golden State Warriors
Houston Rockets
Indiana Pacers
LA Clippers
Los Angeles Lakers
Memphis Grizzlies
Miami Heat
Milwaukee Bucks
Minnesota Timberwolves
New Orleans Pelicans
New York Knicks
Oklahoma City Thunder
Orlando Magic
Philadelphia 76ers
Phoenix Suns
Portland Trail Blazers
Sacramento Kings
San Antonio Spurs
Toronto Raptors
Utah Jazz
Washington Wizards
NBA
PLAYOFFS: 3 GAMES yesterday
PLAYOFFS: 3 GAMES yesterday
NBA
>
NBA
FEATURED
FEATURED
SCORES
STANDINGS
SCHEDULE
STATS
PLAYOFFS
VIDEOS
ODDS
More
NEWS
PLAYER NEWS
INJURIES
TEAMS
SOCIAL
NBA DRAFT
MOCK DRAFT
EDITOR'S PICKS
MORE NBA NEWS
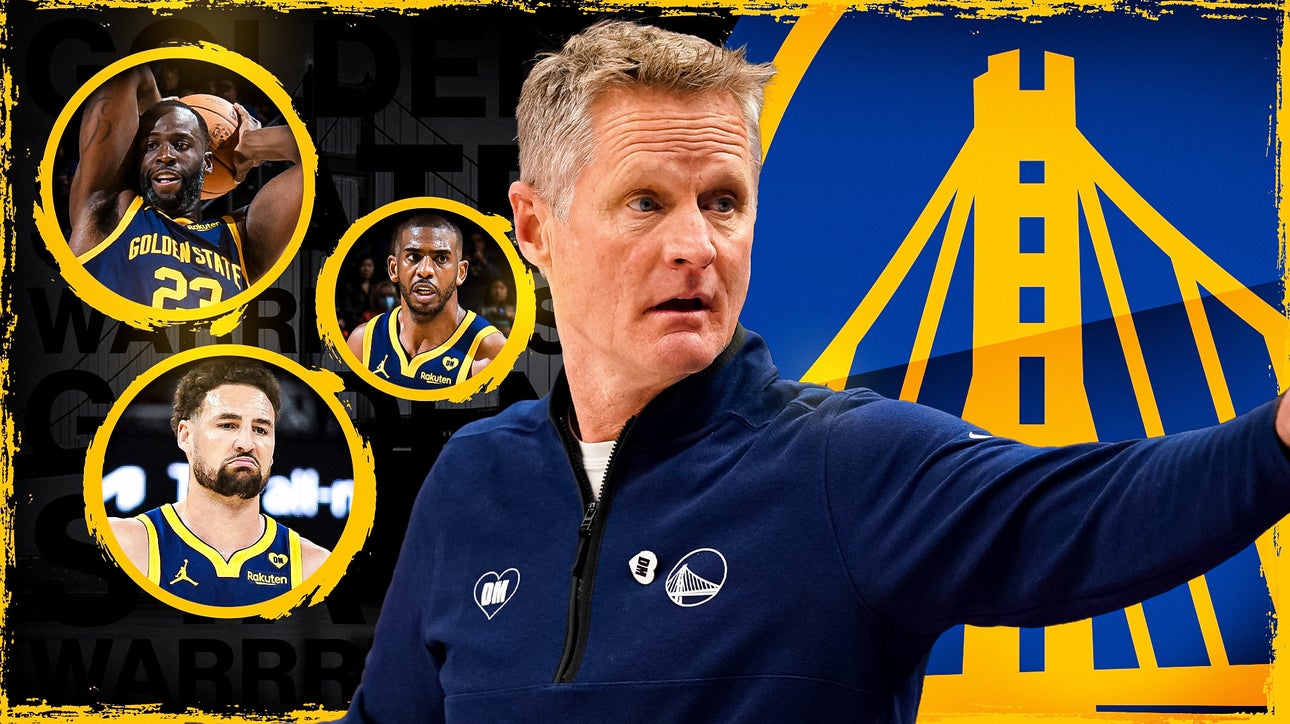
How Steve Kerr navigated his toughest season with Warriors: 'We love each other'
6 DAYS AGO
•
FOX SPORTS
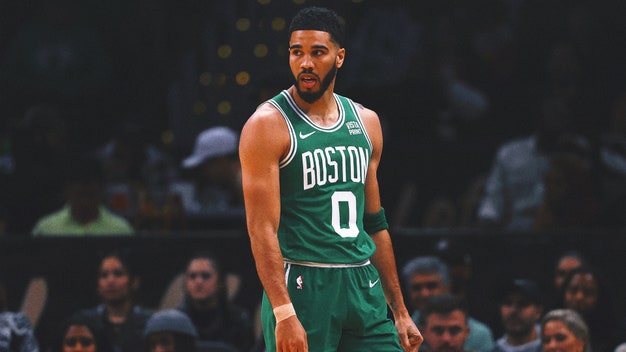
2024 NBA Power Rankings: Can the Celtics and Thunder stay on top?
2 DAYS AGO
•
FOX SPORTS
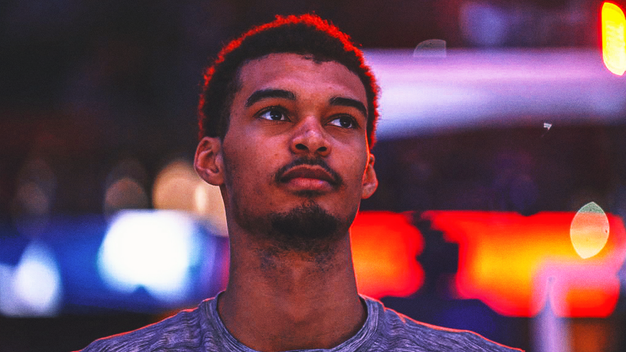
2023-24 NBA Rookie of the Year odds: Wembanyama becomes even bigger favorite
MARCH 18
•
FOX SPORTS
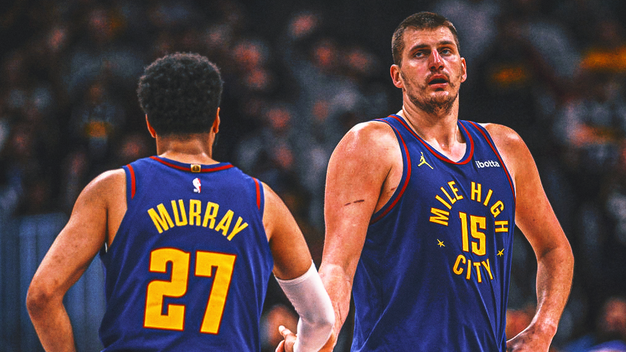
2024 NBA Western Conference odds: Nuggets favored to clinch No. 1 seed
APRIL 12
•
FOX SPORTS
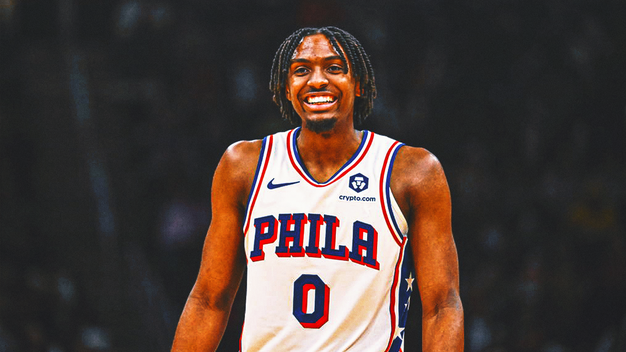
2023-24 NBA Most Improved odds: 76ers' Tyrese Maxey favored, Coby White rising
MARCH 18
•
FOX SPORTS
2024 NBA Play-In Tournament: Bracket, schedule, scores, standings, rules
5 DAYS AGO
•
FOX SPORTS
2024 NBA Playoff Bracket: Updated schedule, scores, standings
33 MINS AGO
•
FOX SPORTS
MORE NBA NEWS
ADVERTISEMENT
TRENDING VIDEOS
MORE NBA VIDEOS
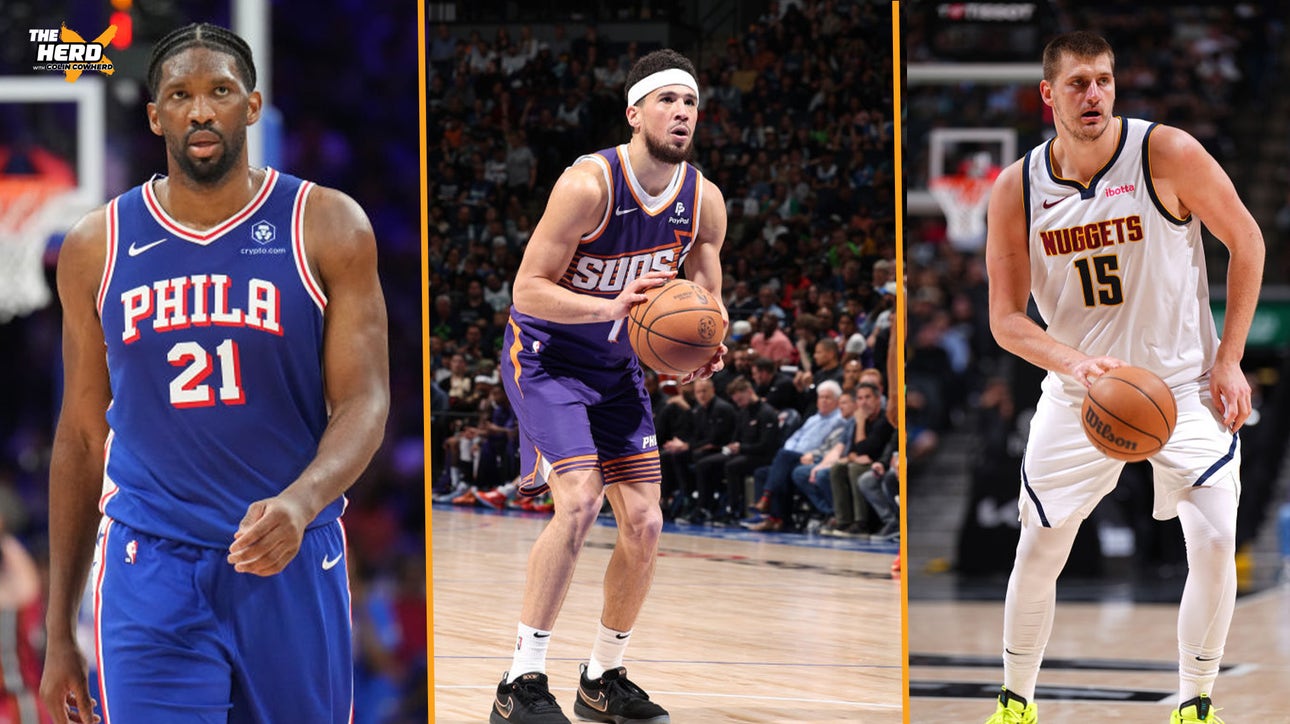
Nuggets, Celtics win conferences, 76ers upset Knicks, Suns advance in Colin's NBA bracket | The Herd
3 DAYS AGO
•
FOX SPORTS
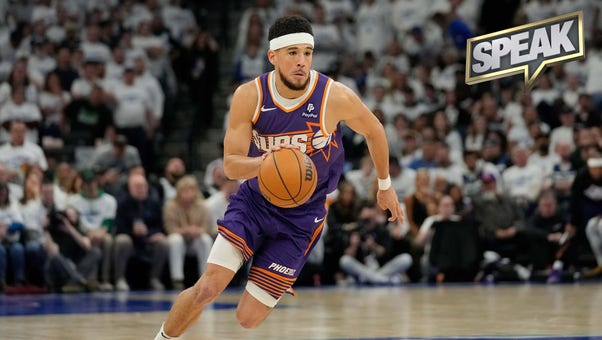
Are the Phoenix Suns in trouble? | Speak
15 HOURS AGO
•
FOX SPORTS
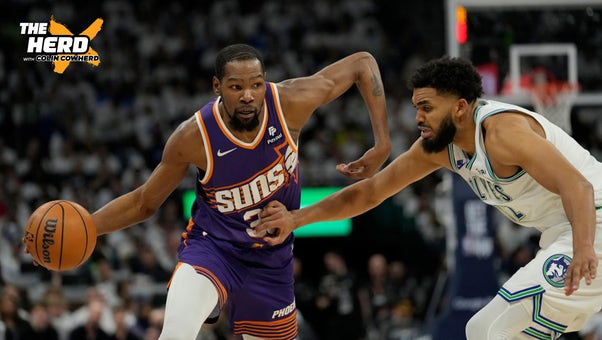
Is Kevin Durant slowly becoming less relevant? | The Herd
19 HOURS AGO
•
FOX SPORTS
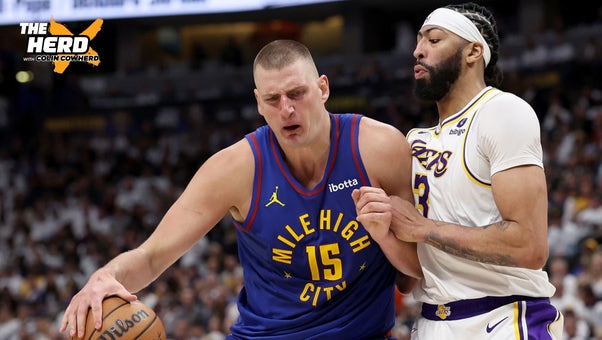
Nuggets continue to expose the Lakers flaws in 114-103 Game 1 win | The Herd
19 HOURS AGO
•
FOX SPORTS
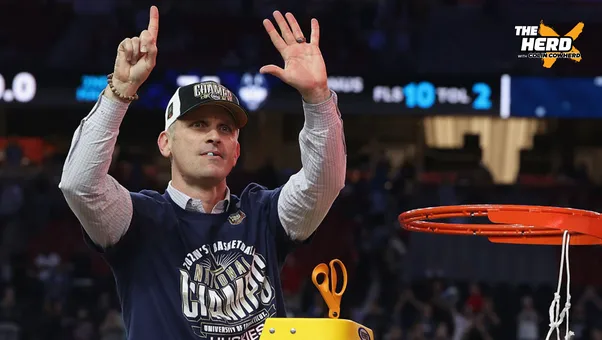
Dan Hurley's priority is 'going for a three-peat' with UConn | The Herd
APRIL 10
•
FOX SPORTS
Should the Lakers feel hopeless after Game 1 loss vs. Nuggets? | Speak
15 HOURS AGO
•
FOX SPORTS
Duke's Jared McCain is John Fanta's guard of the week | CBB on FOX
FEBRUARY 21
•
FOX SPORTS
MORE NBA VIDEOS
FOLLOW THE NBA
Follow your favorites to personalize your FOX Sports experience
BETTING INSIGHTS
MORE NBA BETTING INSIGHTS
2024 NBA Championship odds: Celtics, Nuggets favored for Finals; Thunder surging
19 HOURS AGO
•
FOX SPORTS
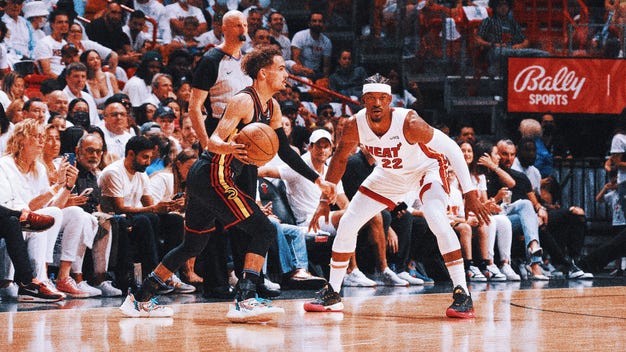
76ers' Tyrese Maxey questionable for Game 2 vs. Knicks; series odds shift
19 HOURS AGO
•
FOX SPORTS
2024 NBA Playoff odds: First-round odds tracker
22 HOURS AGO
•
FOX SPORTS
MORE NBA BETTING INSIGHTS