my favs
Access and manage your favorites here
DISMISS
Home
Scores
Watch
NFL Draft
Podcasts
Odds
Super 6
Stories
Search
Sign In
Account
SPORTS & TEAMS
PLAYERS
SHOWS
PERSONALITIES
SPORTS
SPORTS & TEAMS
PLAYERS
SHOWS
PERSONALITIES
SPORTS
NFL
NCAA FB
MLB
NBA
NCAA BK
NASCAR
Soccer
UFL
NCAAW BK
NHL
Golf
Premier Boxing Champions
WWE
UFC
WNBA
Tennis
Motor Sports
Professional Bowlers Association
Horse Racing
Westminster Kennel Club
FIBA
Olympics
World Baseball Classic
NRL
NBA
NBA
NBA
Atlanta Hawks
Boston Celtics
Brooklyn Nets
Charlotte Hornets
Chicago Bulls
Cleveland Cavaliers
Dallas Mavericks
Denver Nuggets
Detroit Pistons
Golden State Warriors
Houston Rockets
Indiana Pacers
LA Clippers
Los Angeles Lakers
Memphis Grizzlies
Miami Heat
Milwaukee Bucks
Minnesota Timberwolves
New Orleans Pelicans
New York Knicks
Oklahoma City Thunder
Orlando Magic
Philadelphia 76ers
Phoenix Suns
Portland Trail Blazers
Sacramento Kings
San Antonio Spurs
Toronto Raptors
Utah Jazz
Washington Wizards
NBA
PLAYOFFS: 2 GAMES yesterday
PLAYOFFS: 2 GAMES yesterday
NBA
>
NBA
FEATURED
FEATURED
SCORES
STANDINGS
SCHEDULE
STATS
PLAYOFFS
VIDEOS
ODDS
More
NEWS
PLAYER NEWS
INJURIES
TEAMS
SOCIAL
NBA DRAFT
MOCK DRAFT
EDITOR'S PICKS
MORE NBA NEWS
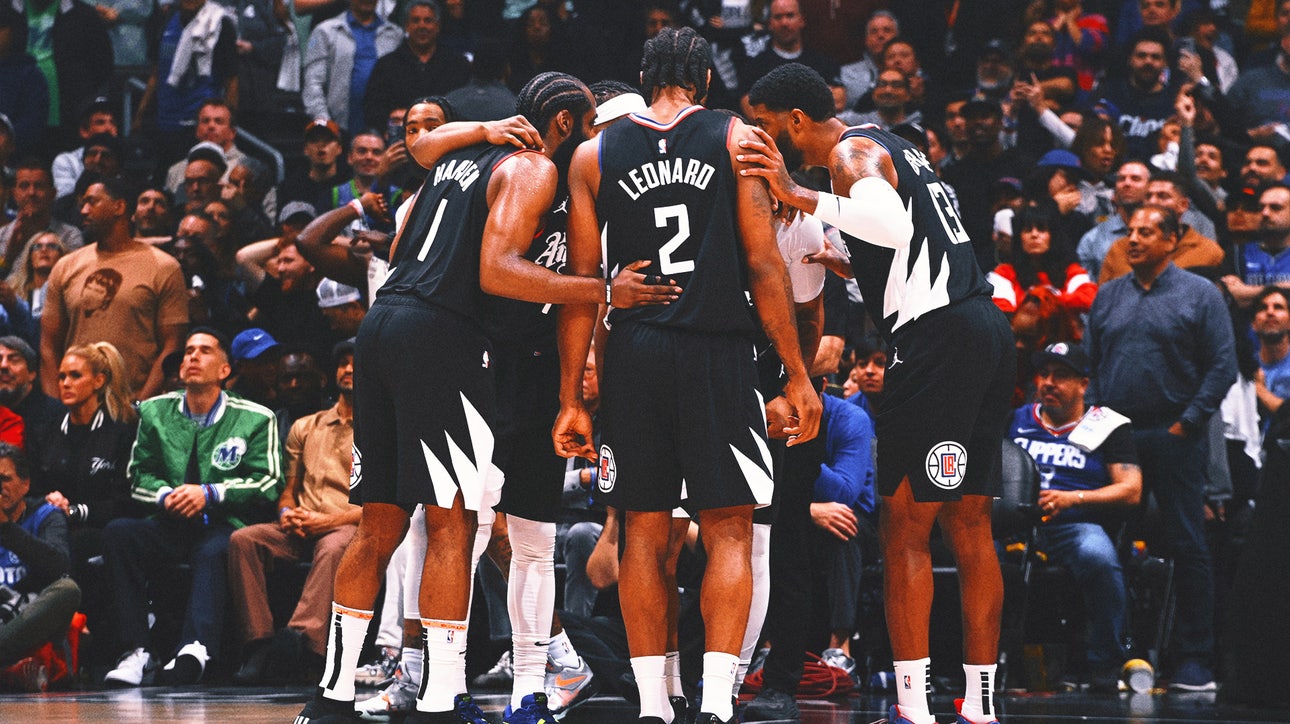
With Kawhi Leonard back in the fold, the Clippers are all out of excuses
20 HOURS AGO
•
FOX SPORTS
2023-24 NBA Awards Winners Tracker: Naz Reid named Sixth Man of the Year over Malik Monk
5 HOURS AGO
•
FOX SPORTS
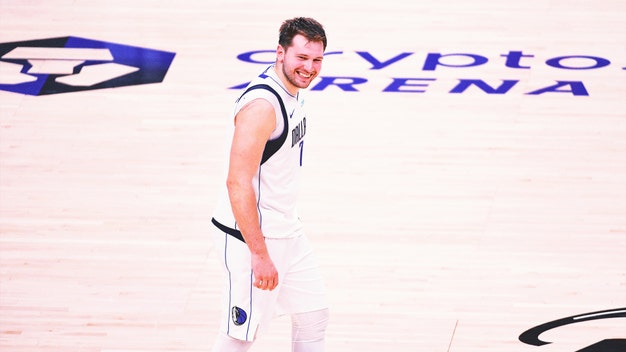
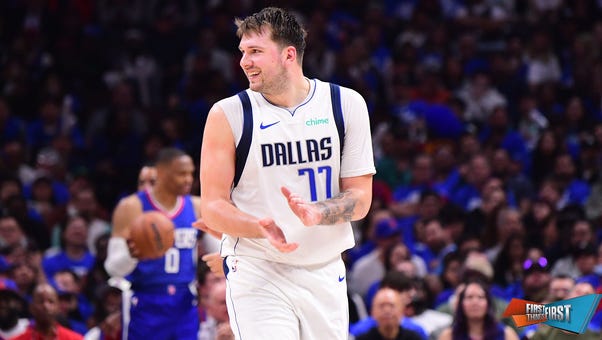
Luka Dončić, Kyrie Irving lead Mavericks over Clippers 96-93 to tie series as Kawhi Leonard returns
22 HOURS AGO
•
FOX SPORTS
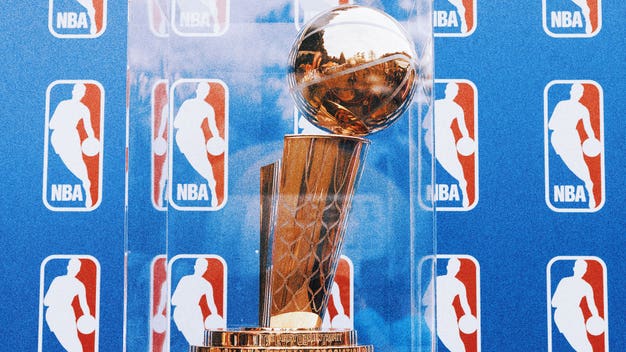
2024 NBA Championship odds: Celtics favored for Finals; Nuggets closing in
1 DAY AGO
•
FOX SPORTS
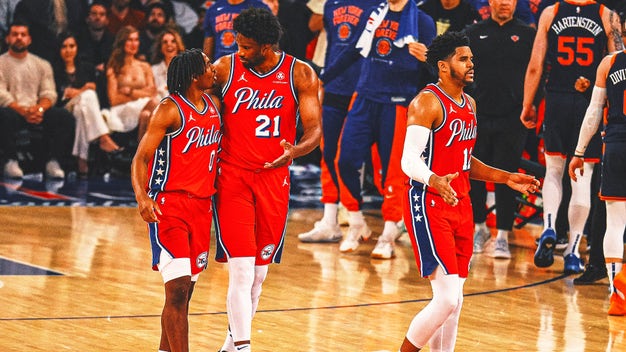
NBA says 76ers' Tyrese Maxey was fouled twice before late turnover in Game 2 loss
1 DAY AGO
•
FOX SPORTS
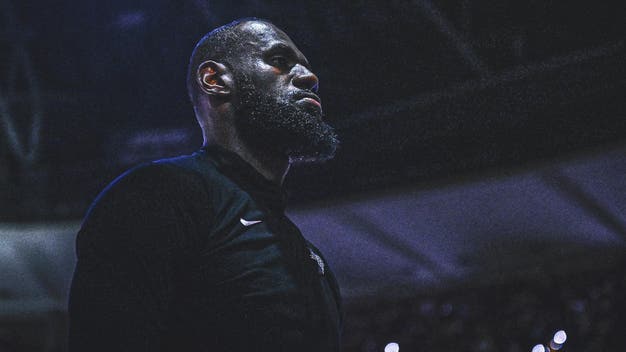
LeBron James rants at NBA's replay center, Lakers lose on buzzer-beater
1 DAY AGO
•
FOX SPORTS
MORE NBA NEWS
ADVERTISEMENT
TRENDING VIDEOS
MORE NBA VIDEOS
Nuggets, Celtics win conferences, 76ers upset Knicks, Suns advance in Colin's NBA bracket | The Herd
5 DAYS AGO
•
FOX SPORTS
Mavs knot series vs. Clippers at 1-1 behind Luka’s heroic performance | First Things First
6 HOURS AGO
•
FOX SPORTS
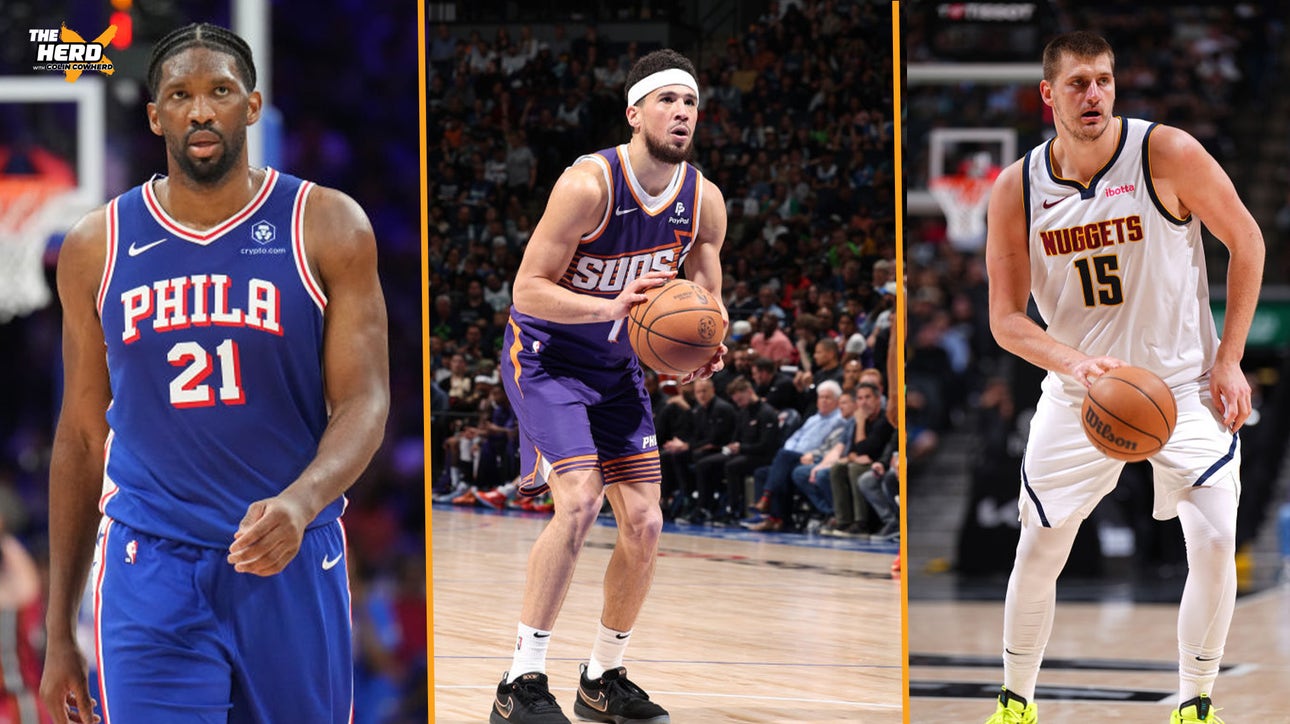
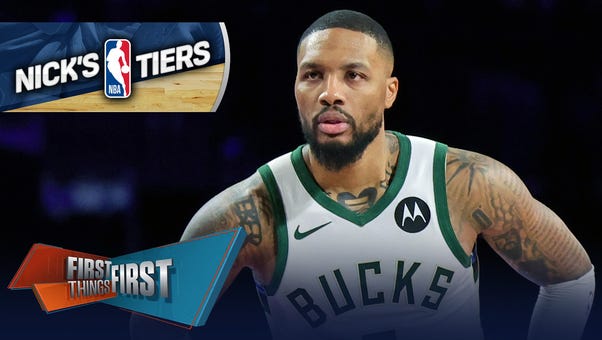
Bucks & Sixers 'trying to avoid disaster' in latest edition of Nick's NBA Tiers | First Things First
6 HOURS AGO
•
FOX SPORTS
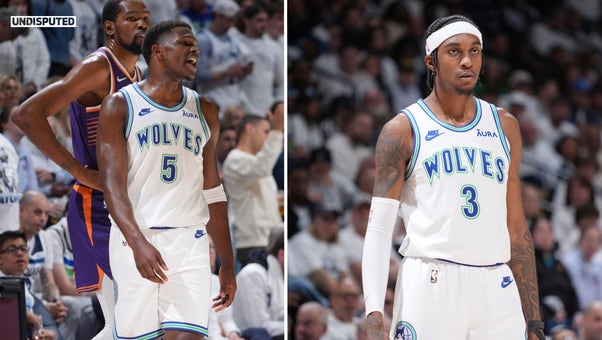
Jaden McDaniels-Anthony Edwards, T-Wolves hold Suns to 93 points in Game 2 win | Undisputed
11 HOURS AGO
•
FOX SPORTS
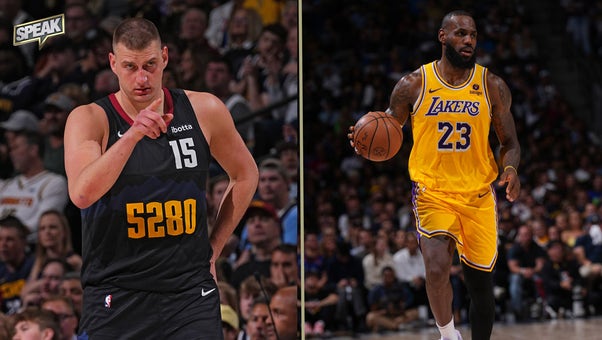
Are the Lakers done after losing 20-point lead in Game 2 loss vs. Nuggets? | Speak
1 DAY AGO
•
FOX SPORTS
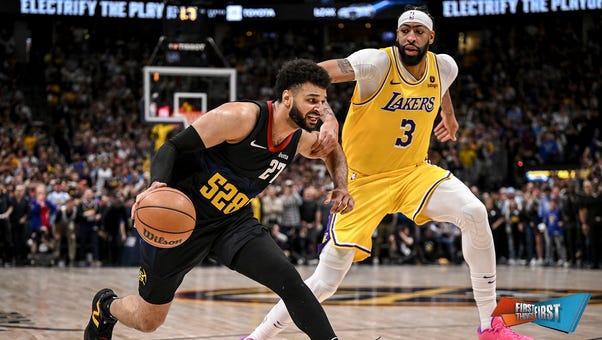
Lakers blow 20-point lead, lose 10th straight vs. Nuggets | First Things First
1 DAY AGO
•
FOX SPORTS
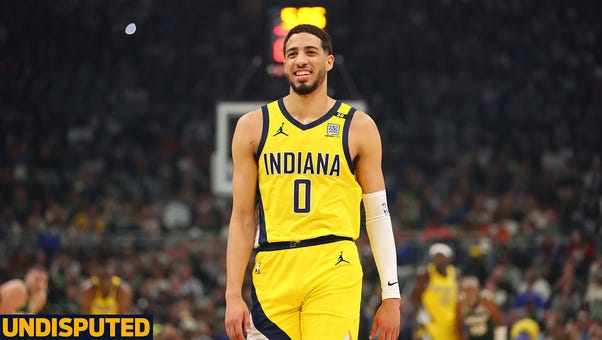
Pacers steal Game 2 vs. Bucks: Haliburton notches double-double & trolls fans postgame | Undisputed
11 HOURS AGO
•
FOX SPORTS
MORE NBA VIDEOS
FOLLOW THE NBA
Follow your favorites to personalize your FOX Sports experience
BETTING INSIGHTS
MORE NBA BETTING INSIGHTS
2024 NBA Playoff odds: First-round odds tracker
9 HOURS AGO
•
FOX SPORTS
2024 NBA Championship odds: Celtics favored for Finals; Nuggets closing in
1 DAY AGO
•
FOX SPORTS
LeBron James rants at NBA's replay center, Lakers lose on buzzer-beater
1 DAY AGO
•
FOX SPORTS
MORE NBA BETTING INSIGHTS